
Page 179 - 2022 Taiwan Health and Welfare Report
P. 179
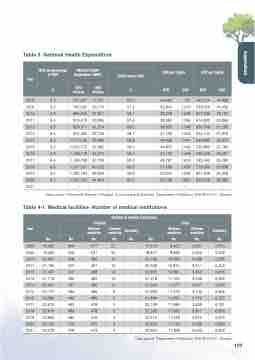
Table 3 National Health Expenditure
  Year
2005
2010
2011
2012
2013
2014
2015
2016
2017
2018
2019
2020
2021
NHE as percentage of GDP
6.2
6.3
6.4
6.3
6.4
6.3
6.2
6.3
6.4
6.6
6.5
6.7
⋯
National Health Expenditure (NHE)
745,620
884,640
913,413
929,311
974,250
1,017,106
1,052,773
1,108,119
1,149,199
1,207,051
1,235,764
1,325,302
⋯
23,170
27,951
30,995
31,374
32,726
33,490
32,992
34,275
37,753
40,022
39,954
44,804
⋯
Public sector ratio
62.0
57.4
58.1
57.6
59.0
58.7
58.8
59.0
58.4
59.2
59.3
59.8
60.5
⋯
NHE per Cpaita
        2000
%
5.3
NTD millions
547,807
USD millions
17,541
%
NTD
24,693
32,804
38,228
39,382
39,935
41,733
43,459
44,870
47,122
48,787
51,189
52,372
56,199
⋯
USD
 791
1,019
1,208
1,336
1,348
1,402
1,431
1,406
1,458
1,603
1,697
1,693
1,900
⋯
NTD
465,574
529,556
607,596
614,922
630,749
654,142
694,680
726,895
746,526
763,445
779,260
801,348
839,558
⋯
USD
14,908
16,456
19,197
20,866
21,295
21,973
22,874
22,780
23,091
25,080
25,838
25,908
28,383
 Data source: Directorate-General of Budget, Accounting and Statistics, Department of Statistics, MOHW, R.O.C. (Taiwan)
Table 4-1 Medical facilities- Number of medical institutions
⋯
          Year
Number of medical institutions
 Hospital
 Clinic
Western medicine
 Chinese medicine
  Dentistry
Western medicine
 Chinese medicine
  Dentistry
 No.
 No.
 No.
 No.
 No.
 No.
 No.
 No.
 No.
2000
18,082
669
617
52
-
17,413
9,402
2,461
5,550
2005
19,433
556
531
25
-
18,877
9,948
2,900
6,029
2010
20,691
508
492
16
-
20,183
10,599
3,289
6,295
2011
21,135
507
491
16
-
20,628
10,815
3,411
6,402
2012
21,437
502
488
14
-
20,935
10,997
3,462
6,476
2013
21,713
495
482
13
-
21,218
11,105
3,548
6,565
2014
22,041
497
486
11
-
21,544
11,277
3,637
6,630
2015
22,177
494
486
8
-
21,683
11,313
3,705
6,665
2016
22,384
490
485
5
-
21,894
11,395
3,772
6,727
2017
22,612
483
478
5
-
22,129
11,499
3,839
6,791
2018
22,816
483
478
5
-
22,333
11,580
3,917
6,836
2019
22,992
480
476
4
-
22,512
11,663
3,975
6,874
2020
23,132
479
475
4
-
22,653
11,724
4,036
6,893
2021
 23,278
 478
 473
 4
 1
 22,800
 11,835
 4,043
 6,922
   Data source: Department of Statistics, MOHW, R.O.C. (Taiwan)
GDP per Capita
177
  Appendices
