
Page 180 - 2022 Taiwan Health and Welfare Report
P. 180
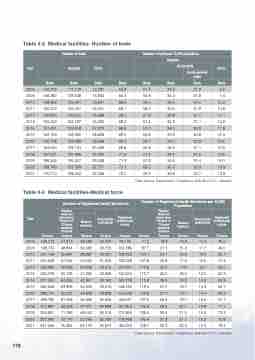
Table 4-2 Medical facilities- Number of beds
 Year
Number of beds
  Number of beds per 10,000 population
Hospital
Clinic
 Hospital
 Clinic
 Acute beds
 Acute general beds
 Beds
 Beds
 Beds
 Beds
 Beds
 Beds
 Beds
 Beds
 2000
126,476
114,179
12,297
56.8
51.3
33.3
31.0
5.5
2005
146,382
129,548
16,834
64.3
56.9
34.4
31.8
7.4
2010
158,922
135,401
23,521
68.6
58.5
35.0
32.0
10.2
2011
160,472
135,431
25,041
69.1
58.3
35.0
31.9
10.8
2012
160,900
135,002
25,898
69.0
57.9
34.8
31.7
11.1
2013
159,422
134,197
25,225
68.2
57.4
34.3
31.1
10.8
2014
161,491
133,518
27,973
68.9
57.0
34.0
30.9
11.9
2015
162,163
133,335
28,828
69.0
56.8
33.9
30.8
12.3
2016
163,148
133,499
29,649
69.3
56.7
34.0
30.9
12.6
2017
164,590
134,134
30,456
69.8
56.9
34.2
31.1
12.9
2018
167,521
135,496
32,025
71.0
57.4
34.6
31.5
13.6
2019
168,266
135,257
33,009
71.3
57.3
34.6
31.4
14.0
2020
169,780
137,029
32,751
72.1
58.2
35.2
32.0
13.9
2021
 170,710
 138,442
 32,268
 73.0
 59.2
 35.9
 32.7
 13.8
  Table 4-3 Medical facilities-Medical force
Data source: Department of Statistics, MOHW, R.O.C. (Taiwan)
Year
Number of Registered Health Workforce
Number of Registered Health Workforce per 10,000 Population
 Western medicine physicians, Doctors of Chinese medicine, Dentists
   Pharmacists (assistants)
 Registered professional nurses
 Western medicine physicians, Doctors of Chinese medicine, Dentists
   Pharmacists (assistants)
 Registered professional nurses
Western medicine
Western medicine
 Persons
 Persons
 Persons
 Persons
 Persons
 Persons
 Persons
 Persons
 Persons
 Persons
 2000
159,212
41,915
29,585
24,404
79,176
71.5
18.8
13.3
11.0
35.5
2005
199,734
48,844
34,093
26,750
104,786
87.7
21.5
15.0
11.7
46.0
2010
241,156
55,897
38,887
30,001
128,955
104.1
24.1
16.8
13.0
55.7
2011
250,258
57,564
40,002
31,300
133,336
107.8
24.8
17.2
13.5
57.4
2012
258,283
59,069
40,938
32,015
137,641
110.8
25.3
17.6
13.7
59.0
2013
265,759
60,736
41,965
32,668
140,915
113.7
26.0
18.0
14.0
60.3
2014
271,555
62,295
42,961
33,162
142,708
115.9
26.6
18.3
14.2
60.9
2015
280,508
63,806
44,006
33,516
148,223
119.4
27.2
18.7
14.3
63.1
2016
289,174
65,202
44,849
33,908
153,509
122.8
27.7
19.1
14.4
65.2
2017
299,782
67,428
46,356
34,526
159,621
127.2
28.6
19.7
14.6
67.7
2018
312,887
69,069
47,471
34,838
167,803
132.6
29.3
20.1
14.8
71.1
2019
326,691
71,766
49,542
35,316
172,966
138.4
30.4
21.0
15.0
73.3
2020
337,942
73,776
51,045
35,734
178,498
143.4
31.3
21.7
15.2
75.8
2021
 347,555
 75,384
 52,175
 35,977
 183,253
 148.7
 32.3
 22.3
 15.4
 78.4
    178
Data source: Department of Statistics, MOHW, R.O.C. (Taiwan)
