
Page 182 - 2022 Taiwan Health and Welfare Report
P. 182
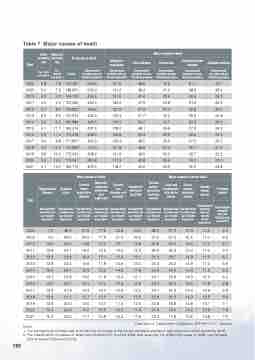
Table 7 Major causes of death
 Year
Infant mortality rate
Maternal mortality rate
All causes of death
Major causes of death
 Malignant neoplasms
  Heart disease
  Pneumonia
  Cerebrovascular disease
  Diabetes mellitus
  Per 1,000 live births
 Per 100,000 live births
 Deaths
 Standardized mortality rate per 100,000 population
Standardized mortality rate per 100,000 population
Standardized mortality rate per 100,000 population
Standardized mortality rate per 100,000 population
Standardized mortality rate per 100,000 population
Standardized mortality rate per 100,000 population
 2000
5.8
7.8
124,481
569.4
141.6
48.8
15.6
61.1
42.7
2005
5.0
7.3
138,957
530.0
141.2
48.3
21.0
48.9
39.4
2010
4.2
4.2
144,709
455.6
131.6
47.4
25.6
30.6
25.3
2011
4.2
5.0
152,030
462.4
132.2
47.9
24.8
31.3
26.9
2012
3.7
8.5
153,823
450.6
131.3
47.9
24.4
30.8
26.5
2013
3.9
9.2
154,374
435.3
130.4
47.7
22.5
30.3
25.8
2014
3.6
6.6
162,886
443.5
130.2
50.2
24.7
30.4
26.0
2015
4.1
11.7
163,574
431.5
128.0
48.1
24.6
27.9
24.3
2016
3.9
11.6
172,418
439.4
126.8
50.3
26.9
28.6
24.5
2017
4.0
9.8
171,857
424.3
123.4
48.5
26.5
27.5
23.5
2018
4.2
12.2
172,859
415.0
121.8
48.8
27.4
26.1
21.5
2019
3.8
16.0
175,424
408.2
121.3
43.6
30.0
26.7
22.3
2020
3.6
13.0
173,067
390.8
117.3
43.8
26.4
25.2
22.0
2021
 4.1
 14.0
 184,172
 405.5
 118.2
 45.6
 25.3
 25.2
 23.8
   Year
Major causes of death
Major causes of cancer death
  Hypertensive disease
   Accident injury
   Chronic lower respiratory disease
   Nephritis, nephrotic syndrome and nephrosis
 Chronic liver disease and cirrhosis
  Intentional self-harm (suicide)
  Trachea cancer, bronchus and lung cancer
   Liver and intrahepatic bile ducts cancer
   Colon,
rectum and anus cancer
 Female breast cancer
 Prostate cancer
  Standardized mortality rate per 100,000 population
 Standardized mortality rate per 100,000 population
 Standardized mortality rate per 100,000 population
  Standardized mortality rate per 100,000 population
 Standardized mortality rate per 100,000 population
 Standardized mortality rate per 100,000 population
Standardized mortality rate per 100,000 population
 Standardized mortality rate per 100,000 population
  Standardized mortality rate per 100,000 population
  Standardized mortality ratio per 100,000 female population
 Standardized mortality ratio per 100,000 male population
 2000
7.5
46.5
21.9
17.9
22.6
10.6
28.0
27.0
15.3
10.3
5.7
2005
7.0
34.0
20.0
17.9
21.3
16.6
27.4
27.3
15.5
11.0
6.6
2010
12.2
24.4
14.8
12.4
16.1
13.8
25.8
25.2
14.6
11.0
6.1
2011
12.9
24.1
16.2
12.6
16.5
12.3
26.0
25.3
15.0
11.6
6.4
2012
13.3
23.8
16.4
12.1
15.6
13.1
25.4
24.7
14.9
11.6
6.7
2013
12.9
22.4
14.9
11.9
14.8
12.0
25.3
24.2
14.9
11.6
6.6
2014
13.5
23.7
15.3
12.5
14.8
11.8
25.3
23.3
15.3
11.9
6.5
2015
13.2
22.8
14.6
11.8
13.6
12.1
24.7
22.8
14.9
12.0
6.4
2016
13.5
23.1
15.1
12.4
13.4
12.3
24.4
22.2
14.6
11.8
6.8
2017
13.3
21.9
13.3
12.4
12.6
12.5
23.1
21.6
14.4
12.6
6.9
2018
12.8
21.1
12.7
12.3
11.6
12.5
22.8
20.3
14.0
12.5
6.6
2019
12.9
20.0
12.6
10.7
11.2
12.6
22.8
18.8
14.9
13.1
7.1
2020
13.4
20.3
11.0
10.5
10.3
11.8
21.8
18.0
14.6
12.8
7.8
2021
 15.2
 20.0
 11.7
 10.9
 10.4
 11.6
 22.2
 17.9
 14.6
 13.8
 7.5
   180
Notes:
1. The standardized mortality rate is worked out according to the world's standard population age structure of 2000 gained by WHO. 2. The classification of causes of death has followed ICD-10 since 2008, and selecting the underlying cause of death has followed
ICD-10 version 2016 since 2019.
Data source: Department of Statistics, MOHW, R.O.C. (Taiwan)
