
Page 183 - 2022 Taiwan Health and Welfare Report
P. 183
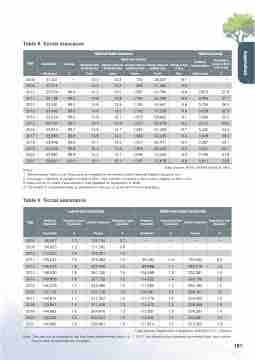
Table 8 Social insurance
 2013
2014
2015
2016
2017
2018
2019
2020
2021
23,463
23,622
23,737
23,815
23,880
23,948
24,020
23,987
23,861
99.6
99.6
99.7
99.7
99.8
99.8
99.8
99.9
100.0
National Health Insurance
14.8
14.8
14.9
14.7
14.9
14.8
15.1
15.4
14.2
13.1
13.8
13.5
13.7
13.9
14.1
14.2
14.5
14.8
14.1
13.1
1,192
1,223
1,257
1,297
1,386
1,427
1,469
1,596
1,747
57,259
58,662
59,076
61,458
63,245
65,411
66,023
70,442
75,819
9.9
9.7
9.5
9.7
9.4
9.4
9.3
9.3
9.6
National a
     Year
Beneficiaries
Coverage
Health Care Utilization
Number of insured objects
3,678
3,584
3,510
3,425
3,349
3,287
3,231
3,106
2,911
Percentage in people at 25-64 years of age
   2000
2005
2010
2011
2012
21,401
22,315
23,074
23,199
23,281
⋯
⋯
99.4
99.5
99.5
Times
14.0
14.5
14.3
14.8
Notes:
1. "Beneficiaries" refers to all those who are eligible for enrollment under National Health Insurance Act.
2. Coverage = Number of people enrolled in NHI / Total number of people in the country eligible for NHI x 100. 3. Data source for health care utilization was updated on September 6, 2022.
4. The length of hospitalized stay is equivalent to the sum of acute and chronic bed days.
Table 9 Social assistance
Cases
12.3
13.2
13.5
13.8
725
909
1,087
1,106
1,135
38,337
51,406
54,794
55,346
55,661
8.7
9.9
9.9
9.9
9.8
Data Source: NHIA, MOHW and BLA, MOL.
3,872
3,784
3,726
⋯
⋯
⋯
⋯
27.9
27.1
26.5
25.9
25.2
24.6
24.0
23.5
23.1
22.7
21.9
20.8
           Year
Low-income households
Middle-low-income households
 Number of households
 Proportion of total households
 Number of persons
 Proportion of total population
 Number of households
 Proportion of total households
 Number of persons
 Proportion of total population
 Households
 %
 Persons
 %
 Households
 %
 Persons
 %
2000
66,467
1.0
156,134
0.7
⋯
⋯
⋯
⋯
2005
84,823
1.2
211,292
0.9
⋯
⋯
⋯
⋯
2010
112,200
1.4
273,361
1.2
⋯
⋯
⋯
⋯
2011
128,237
1.6
314,282
1.4
35,420
0.4
120,042
0.5
2012
145,613
1.8
357,446
1.5
88,988
1.1
282,019
1.2
2013
148,590
1.8
361,765
1.5
108,589
1.3
334,391
1.4
2014
149,958
1.8
357,722
1.5
114,522
1.4
349,130
1.5
2015
146,379
1.7
342,490
1.5
117,686
1.4
356,185
1.5
2016
145,176
1.7
331,776
1.4
119,081
1.4
358,161
1.5
2017
142,814
1.7
317,257
1.3
117,776
1.4
350,425
1.5
2018
143,941
1.6
311,526
1.3
115,570
1.3
338,468
1.4
2019
144,863
1.6
304,470
1.3
115,937
1.3
334,237
1.4
2020
146,342
1.6
300,241
1.3
114,840
1.3
325,681
1.4
2021
 146,995
 1.6
 295,901
 1.3
 111,814
 1.2
 312,355
 1.3
   Data source: Department of Statistics, MOHW, R.O.C. (Taiwan)
Note: The new social assistance law has been implemented since Jul. 1, 2011; the identification standard becomes loose, and middle- low-income households are included.
181
nnuity
     Outpatient Visits per Beneficiary
Inpatient Visits per 100 Beneficiaries
Average Costs per Outpatient Case
Average Costs per Inpatient Case
Average Length of Stay
        1,000 persons
%
Points
Points
Days
1,000 persons
%
  Appendices
