
Page 184 - 2022 Taiwan Health and Welfare Report
P. 184
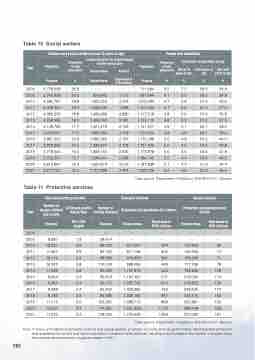
Table 10 Social welfare
 Year
Children and youths welfare (below 18 years of age)
People with disabilities
 Population
 Proportion of total population
 Living assistance for disadvantaged children and youths
 Population
 Proportion of total population
 Distribution of population by age
 Person-times
 Amount
 Below 18 years of age
 18-64 years of age
 Above 65 years of age
 Persons
 %
 Person-times
 Expressed in NTD millions
 Persons
 %
 %
 %
 %
 2000
5,779,069
25.9
⋯
⋯
711,064
3.2
7.2
58.0
34.9
2005
5,242,928
23.0
824,842
1,715
937,944
4.1
6.5
58.5
34.9
2010
4,595,767
19.8
1,355,253
2,054
1,076,293
4.7
5.8
57.6
36.6
2011
4,469,350
19.2
1,348,606
1,998
1,100,436
4.7
5.6
57.4
37.0
2012
4,380,203
18.8
1,466,688
2,880
1,117,518
4.8
5.6
57.6
36.8
2013
4,258,385
18.2
1,406,040
2,781
1,125,113
4.8
5.3
57.2
37.5
2014
4,149,792
17.7
1,401,476
2,742
1,141,677
4.9
5.1
56.7
38.2
2015
4,043,357
17.2
1,385,684
2,709
1,155,650
4.9
4.9
56.1
39.0
2016
3,987,202
16.9
1,382,965
2,797
1,170,199
5.0
4.8
55.2
40.0
2017
3,900,662
16.5
1,339,627
2,708
1,167,450
5.0
4.6
54.6
40.8
2018
3,778,520
16.0
1,309,150
2,635
1,173,978
5.0
4.5
53.6
41.9
2019
3,702,207
15.7
1,239,001
2,498
1,186,740
5.0
4.4
52.4
43.2
2020
3,615,967
15.3
1,200,873
2,516
1,197,939
5.1
4.3
51.3
44.4
2021
 3,517,700
 15.0
 1,157,898
 2,424
 1,203,756
 5,2
 4.3
 50.3
 45.4
  Table 11 Protective services
Data source: Department of Statistics, MOHW, R.O.C. (Taiwan)
 Year
Child and youths protection
 Domestic violence
 Sexual violence
 Number of abused children and youths
Child and youths Abuse Rate
 Number of victims declared
Protection and assistance for victims
Protection and assistance for victims
 Persons
 Per 1,000 people
 Persons
 Person-times
 Expressed in NTD millions
 Person-times
 Expressed in NTD millions
2000
⋯
⋯
⋯
⋯
⋯
⋯
⋯
2005
9,897
1.9
58,614
⋯
⋯
⋯
⋯
2010
18,331
3.9
98,720
601,567
344
100,942
60
2011
17,667
3.9
94,150
871,146
406
140,326
74
2012
19,174
4.3
98,399
915,859
391
158,258
71
2013
16,322
3.8
110,103
988,586
469
177,258
78
2014
11,589
2.8
95,663
1,127,819
534
199,846
109
2015
9,604
2.3
95,818
1,191,465
577
219,024
114
2016
9,461
2.4
95,175
1,297,726
612
218,852
124
2017
9,389
2.4
95,402
1,323,396
743
229,525
173
2018
9,186
2.4
96,693
1,309,184
961
245,515
153
2019
11,113
3.0
103,930
1,499,713
869
340,891
160
2020
12,610
3.4
114,381
1,631,339
1,119
398,148
209
2021
 11,523
 3.2
 118,532
 1,754,639
 1,069
 370,063
 161
   182
Note: In terms of incidents of domestic violence and sexual assault, a number of county and city governments had expanded protection and assistance for victims and raised subsidies to enhance victim services, resulting in an increase in the number of people using the services and the amount of grants funded in 2017.
Data source: Department of Statistics, MOHW, R.O.C. (Taiwan)
