
Page 22 - 2022 Taiwan Health and Welfare Report
P. 22
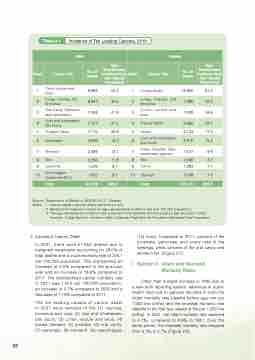
  Table 2-1 Incidence of Ten Leading Cancers, 2019
Male
Female
 Rank
 Cancer Site
 No. of Cases
 Age- Standardized Incidence Rate (Per 100,000 Population)
  Rank
 Cancer Site
 No. of Cases
 Age- Standardized Incidence Rate (Per 100,000 Population)
1
 Colon, rectum and anus
 9,893
 52.3
1
 Female Breast
 14,856
 81.0
2
Lungs, Trachea, and Bronchus
8,847
45.6
2
Lungs, Trachea, and Bronchus
7,386
35.0
3
Oral Cavity, Opharynx, and Hypopharyn
7,468
41.8
3
Colon, rectum and anus
7,409
34.6
4
Liver and Intrahepatic Bile Ducts
7,757
41.0
4
Thyroid Gland
3,582
22.7
5
Prostate Gland
7,115
35.8
5
Uterus
3,124
17.0
6
Esophagus
2,639
14.2
6
Liver and Intrahepatic Bile Ducts
3,515
15.4
7
Stomach
2,389
12.1
7
Ovary, Fallopian Tube, and Broad Ligament
1,677
9.9
8
Skin
2,356
11.8
8
Skin
2,086
8.7
9
Leukemia
1,529
9.7
9
Cervix
1,393
7.7
10
Non-Hodgkin lymphoma (NHL)
1,602
9.1
10
Stomach
1,549
7.0
Total
64,109
345.4
Total
57,145
292.7
  Source : Department of Statistics, MOHW, R.O.C. (Taiwan) Notes : 1. Cancer registry data excludes carcinoma in situ.
2. Ranked from highest to lowest by age-standardized incidence rate (per 100,000 population).
3. The age-standardized incidence rate is based on the standard world population age structure in 2000.
Formula: Σ(Age-Specific Incidence Rate x Standard Age-Specific Population)/Standard Total Population.
2. Causes of Cancer Death
In 2021, there were 51,656 deaths due to malignant neoplasms accounting for 28.0% of total deaths and a crude mortality rate of 220.1 per 100,000 population. This represented an increase of 3.5% compared to the previous year and an increase of 18.6% compared to 2011. The standardized cancer mortality rate in 2021 was 118.2 per 100,000 population, an increase of 0.7% compared to 2020 and a decrease of 11.5% compared to 2011.
The ten leading causes of cancer death in 2021 were cancers of the (1) trachea, bronchus and lung; (2) liver and intrahepatic bile ducts; (3) colon, rectum and anus; (4) breast (female); (5) prostate; (6) oral cavity; (7) pancreas; (8) stomach; (9) oesophagus;
(10) ovary. Compared to 2011, cancers of the prostrate, pancreas, and ovary rose in the rankings, while cancers of the oral cavity and stomach fell. (Figure 2-7).
▏Section 3
Infant and Neonatal Mortality Rates
Other than a slight increase in 1995 due to a new birth reporting system, advances in public health have led to general declines in both the infant mortality rate (deaths before age one per 1,000 live births) and the neonatal mortality rate (deaths in the first four weeks of life per 1,000 live births). In 2021, the infant mortality rate declined to 4.1‰, compared to 8.9‰ in 1981. Over the same period, the neonatal mortality rate dropped from 3.1‰ to 2.7‰ (Figure 2-8).
 20
