
Page 34 - 2022 Taiwan Health and Welfare Report
P. 34
▏Section 4 Mortality Rates
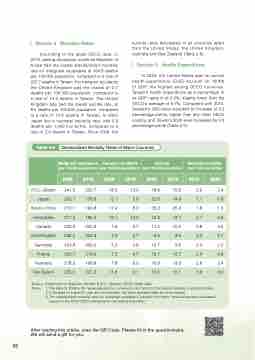
According to the latest OECD data, in 2019, among developed countries Republic of Korea had the lowest standardized mortality rate for malignant neoplasms at 164.8 deaths per 100,000 population, compared to a rate of 222.7 deaths in Taiwan. For transport accidents the United Kingdom was the lowest at 2.7 deaths per 100,000 population, compared to a rate of 13.3 deaths in Taiwan. The United Kingdom also had the lowest suicide rate, at 8.5 deaths per 100,000 population, compared to a rate of 15.6 deaths in Taiwan. In 2020 Japan led in neonatal mortality rate, with 0.8 deaths per 1,000 live births, compared to a rate of 2.4 deaths in Taiwan. Since 2009, the
suicide rates decreased in all countries apart from the United States, the United Kingdom, Australia and New Zealand (Table 2-6).
▏Section 5 Health Expenditure
In 2020, the United States saw its current health expenditure (CHE) account for 18.8% of GDP, the highest among OECD countries. Taiwan's health expenditure as a percentage of its GDP came in at 6.2%, slightly lower than the OECD's average of 9.7%. Compared with 2010, Sweden's 2020 level recorded an increase of 3.2 percentage points, higher than any other OECD country, and Taiwan's 2020 level increased by 0.3 percentage points (Table 2-7).
Table 2-6 Standardized Mortality Rates of Major Countries
Malignant neoplasms (per 100,000 population)
Transport accidents (per 100,000 population)
Suicide
(per 100,000 population)
Neonatal mortality (per 1,000 live births)
2009
2019
2009
2019
2009
2019
2010
2020
R.O.C. (Taiwan)
241.5
222.7
18.0
13.3
18.6
15.6
2.6
2.4
Japan
202.1
176.6
5.1
2.8
22.8
14.6
1.1
0.8
Republic of Korea
210.1
164.8
17.4
8.2
35.3
25.4
1.8
1.3
United States
217.4
185.5
13.1
12.9
12.4
14.7
4.1
3.6
Canada
232.9
200.3
7.9
4.7
11.2
10.5
3.8
3.5
United Kingdom
248.5
224.3
4.3
2.7
6.9
8.5
3.0
2.7
Germany
224.8
209.2
5.3
3.8
10.7
9.6
2.3
2.2
France
229.7
213.6
7.2
4.7
16.7
12.7
2.5
2.6
Australia
218.2
198.8
7.8
6.0
10.8
13.3
2.8
2.4
New Zealand
235.0
221.2
11.6
9.1
12.0
12.1
3.6
3.0
Source : Department of Statistics, MOHW, R.O.C. (Taiwan); OECD Health Data
Notes : 1. The data for 2009 is the "value adjusted by conversion ratio" and not the original releases of statistical data.
2. If the data for a specific year are not available, the latest available data are used instead.
3. The standardized mortality rates for malignant neoplasms, transport accidents, and suicide were calculated
based on the 2015 OECD standards for calculating population.
After reading this article, scan the QR Code. Please fill-in the questionnaire. We will send a gift for you.
32
