
Page 35 - 2022 Taiwan Health and Welfare Report
P. 35
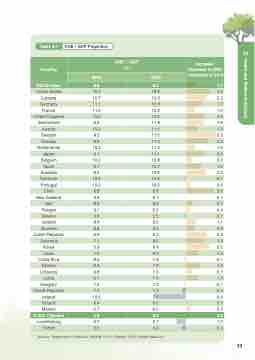
 Table 2-7 CHE / GDP Proportion
 CHE / GDP Country (%)
2010
2020
Increase Decrease in 2020 compared to 2010
France 11.2 12.2
Denmark 10.6 10.5
Portugal 10.0 10.5
New Zealand 9.6 9.7
Italy 8.9 9.6
Finland 9.1 9.5
Greece 9.6 9.5
Iceland 8.4 9.5
Slovenia 8.6 9.5
Israel 7.0 8.3
Costa Rica 8.0 7.9
Lithuania 6.8 7.5
Latvia 6.1 7.4
Hungary 7.4 7.3
Slovak Republic 7.7 7.3
/
0.5
02
    OECD mean 8.6 9.7
1.1
    United States 16.2 18.8
2.6
 Canada 10.7 12.9
2.2
 Germany 11.1 12.8
1.7
1.0
 United Kingdom 10.0 12.0
Switzerland 9.9 11.8
Austria 10.2 11.5
Sweden 8.3 11.5
2.0
 1.9
1.3
 3.2
 Norway 8.9 11.3
Netherlands 10.2 11.2
Belgium 10.2 10.8
Spain 9.1 10.7
Australia 8.4 10.6
2.4
1.0
 Japan 9.1 11.1
2.0
0.6
1.6
 2.2
 -0.1
 Chile 6.8 9.8
3.0
0.1
0.7
0.4
-0.1
1.1
0.9
 Czech Republic 6.9 9.2
2.3
 Colombia 7.1 9.0
1.9
 Korea 5.9 8.4
2.5
1.3
-0.1
 Estonia 6.3 7.8
1.5
0.7
1.3
-0.1
-0.4
 Ireland 10.5 7.1
Poland 6.4 6.5
Mexico 5.7 6.2
 R.O.C. (Taiwan) 5.9 6.2
Luxembourg 6.7 5.7
Türkiye 5.0 4.6
Source : Department of Statistics, MOHW, R.O.C (Taiwan); OECD Health Statistics
-3.4
0.1
0.5
0.3
-1.0
-0.4
  33
     Health and Welfare Indicators
