
Page 33 - 2022 Taiwan Health and Welfare Report
P. 33
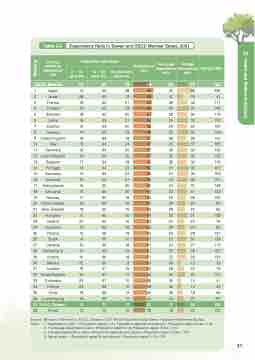
 Table 2-5 Dependency Ratio in Taiwan and OECD Member States, 2021
  Country- ranked by dependency ratio
Population structure
Young-age Old-age
Dependency dependency dependency Aging index
 0 - 14 years (%)
15 - 64 years (%)
65 years and above (%)
ratio ratio ratio
  OECD Median 16 65 19 54 25 29 122
   1 Japan 12 60 28 68 20 48 236
 2 Israel 28 60 12 66 47 19 41
3 France 18 62 21 62 29 34 117
4 Finland 16 62 23 62 25 37 146
5 Sweden 18 62 20 61 28 32 114
6 Latvia 16 63 21 58 25 33 130
7 Estonia 16 63 20 58 26 32 124
8 Greece 14 63 23 58 22 36 159
9 United Kingdom 18 64 19 57 28 29 104
10 Italy 13 64 24 57 20 37 183
11Denmark 16 64 20 57 26 32 124
12 Czech Republic 16 64 20 57 25 32 126
13Belgium 17 64 19 56 26 30 115
14 Portugal 13 64 22 56 21 35 167
15Germany 14 64 22 56 21 34 159
16 Slovenia 15 64 21 56 23 32 137
17 Netherlands 16 65 20 55 24 31 128
18 Lithuania 15 65 20 54 23 31 132
19 Norway 17 65 18 54 26 28 105
20 United States 18 64 16 54 28 25 90
21 New Zealand 19 65 16 54 29 25 85
22Hungary 15 65 20 54 22 31 139
23 Ireland 20 65 15 53 31 23 74
24 Australia 19 65 16 53 29 24 85
25 Poland 15 66 19 52 24 28 121
26 Spain 14 66 20 52 22 30 139
27 Canada 16 66 18 51 24 27 113
28 Switzerland 15 66 19 51 23 28 125
29 Austria 14 66 19 51 22 29 134
30 Mexico 25 66 8 50 38 12 33
31 Iceland 19 67 15 50 28 22 79
32 Slovak Republic 16 67 17 49 24 25 107
33Colombia 23 67 10 49 35 14 41
34 Türkiye 23 68 10 48 34 14 42
35 Chile 19 68 12 46 28 18 66
36 Luxembourg 16 69 15 44 23 21 91
 37 R.O.C. (Taiwan) 12 71 17 41 17 24 136
38 Korea 13 72 16 39 18 22 124
 Source : Ministry of the Interior, R.O.C. (Taiwan); 2021 World Population Data Sheet, Population Reference Bureau Notes : 1. Dependency ratio = (Population aged 0-14+ Population aged 65 and above) / Population aged 15-64 x 100
2. Young-age dependency ratio= (Population aged 0-14)/ Population aged 15-64 x 100
3. Old-age dependency ratio= (Population aged 65 and above) / Population aged 15-64 x 100 4. Aging index = (Population aged 65 and above) / Population aged 0-14 x 100
31
02
        Ranking
   Health and Welfare Indicators
Ranking
