
Page 17 - 2022 Taiwan Health and Welfare Report
P. 17
Rising incomes, improved living environment and nutrition, advances in medicine and health care, and greater health awareness have led to a gradual increase in Taiwan's life expectancy. As baby boomers become older, and the birth rate declines, one must pay greater attention to the health needs of an aging population. The changing demographics may affect not only national health expenditure (NHE) and resource distributions, but also the rate of economic growth. In this section, we address these topics by examining important health and welfare indicators, including population indicators, vital indicators, NHE, social welfare indicators, and international comparisons.
Chapter 1 Population Indicators
At the end of 2021, Taiwan had a registered population of 23.38 million, a decrease of 7.89‰ from 2020. There were 11.58 million males, a decrease of 8.14‰, and 11.8 million females, a decrease of 7.64‰. The sex ratio (the ratio of males to females in a population) was 98.15.
02
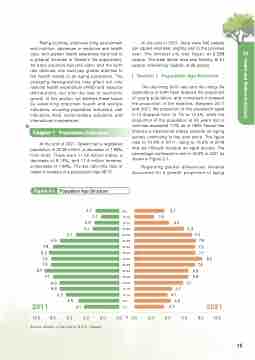
Figure 2-1
6.9
6.9 6.9
8.0
Population Age Structure
2.7
2.9 3.1
2.1
80+
75-79
70 -74
65-69
60-64
55-59
50-54
45-49
40-44
35-39
30-34
25-29
20-24
15-19
10 -14
5-9 4.6 2021 0-4 3.7
At the end of 2021, there were 646 people per square kilometer, slightly less to the previous year. The densest city was Taipei, at 9,288 people. The least dense area was Taitung, at 61 people, followed by Hualien, at 69 people.
▏Section 1 Population Age Structure
The declining birth rate and the rising life expectancy at birth have reduced the proportion of young population, and conversely increased the proportion of the elderlies. Between 2011 and 2021, the proportion of the population aged 0-14 dropped from 15.1% to 12.4%, while the proportion of the population at 65 years old or over has exceeded 7.0% as of 1993. Taiwan has entered a transitional phase towards an aging society continuing to rise ever since. The figure rose to 10.9% in 2011, rising to 14.6% in 2018 and we officially became an aged society. The percentage continued to rise to 16.9% in 2021 as shown in Figure 2-1.
Regarding gender differences, females accounted for a greater proportion of aging
3.7 2.5
7.2 7.8
7.6 7.7
8.5 7.6
6.8
6.8 6.1
4.7 4.1
0.0 % 0.0 2.0 4.0 6.0 8.0 10.0
4.4
6.3
5.1
7.8 8.2
7.9
7.9 8.7
7.7
2011
10.0
6.2
4.8 6.0
4.1
Source: Ministry of the Interior, R.O.C. (Taiwan)
4.0
2.0
15
Health and Welfare Indicators
