
Page 18 - 2022 Taiwan Health and Welfare Report
P. 18
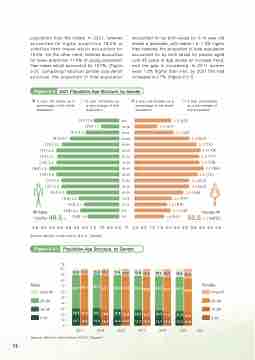
 population than the males. In 2021, females accounted for higher proportion 18.2% of elderlies than males which accounted for 15.5%. On the other hand, females accounted for lower proportion 11.8% of young population than males which accounted for 13.0%. (Figure 2-2). Comparing historical gender population structure, the proportion of total population
accounted for by both sexes for 0-14 year old shows a decrease, with males 1.2~1.3% higher than females; the proportion of total population accounted for by both sexes for people aged over 65 years of age shows an increase trend, and the gap is increasing. In 2011 women were 1.2% higher than men; by 2021 this had increased to 2.7%. (Figure 2-2-1)
 Figure 2-2 2021 Population Age Structure, by Gender
 5 year old males as a percentage of the whole population
()5 year old males as a percentage of that population
(3.1)1.6 (2.2)1.1
5 year old females as a percentage of the whole population
()5 year old females as a percentage of that population
     (4.1)2.0
80+ 2.2(4.3) 75-79   1.4(2.7)
3.7(7.4) 4.0(7.9)
3.9(7.7) 3.9(7.8)
4.3(8.6) 3.8(7.5)
3.3(6.5) 3.3(6.5)
2.3(4.6) 3.3(6.5)
  (6.0)3.0 (7.0)3.5
(7.7)3.8 (7.5)3.7 (7.6)3.8
(8.5)4.2 (7.6)3.8
(7.1)3.5 (7.1)3.5
70 -74
65-69
60-64
55-59
50-54
45-49
40-44
35-39
30-34
25-29
20-24   2.9(5.8) 15-19   2.2(4.4)
                    (6.4)3.2 (5.0)2.5
(4.3)2.1 Male (4.8)2.4
(100%)49.5 % (3.9)1.9
2.0(3.9)
1.8(3.5) 50.5 %(100%)
    10 -14
5-9   2.2(4.3) Female
   0-4
  5.04.54.03.53.02.52.01.51.00.50.0 % 0.00.51.01.52.02.53.03.54.04.55.0 Source: Ministry of the Interior, R.O.C. (Taiwan)
 Figure 2-2-1
Male
Over 65
25-64 15-24 0-14
Population Age Structure, by Gender
 %
100 90 80 70 60 50 40 30 20 10 0
10.3 11.5
59.7 60.7
14.3 13.3 15.7 14.5
10.8 12.3
60.2 61.1
14.1 13.0 14.9 13.7
11.6 13.4
60.4 61.0
13.8 12.6 14.2 13.0
12.8 14.9
60.3 60.6
13.2 12.0 13.7 12.5
14.1 16.5
60.3 60.2
12.3 11.2 13.4 12.2
15.5 18.2
              16
2011
Source: Ministry of the Interior, R.O.C. (Taiwan)
Year
2013
2015
2017
2019
2021
60.2
11.4 10.2 13.0 11.8
Female
Over 65
25-64 15-24 0-14
59.8
