
Page 19 - 2022 Taiwan Health and Welfare Report
P. 19
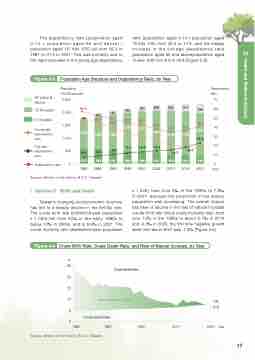
  The dependency ratio [(population aged 0-14 + population aged 65 and above) / population aged 15- 64x 100] fell from 56.3 in 1981 to 41.3 in 2021. This was primarily due to the rapid decrease in the young-age dependency
ratio [population aged 0-14 / population aged 15-64x 100] from 49.4 to 17.5, and the steady increase in the old-age dependency ratio [population aged 65 and above/population aged 15-64x 100] from 6.9 to 23.8 (Figure 2-3).
02
  Figure 2-3
65 years & Above
15-64 years
0-14 years
Population Age Structure and Dependency Ratio, by Year
 Population (10,000 people)
Dependency ratio
70
394 60
50
1,655 40
30
20
2,500 2,000 1,500
56.3
169 197 229 253 311
44.9 42.1
       103 135
   Young-age
dependency
ratio 1,000
Old-age
dependency 500 ratio
1,485
33.5
11.4
23.8 14.7 18.0 17.5
80 52.1
49.4 49.0
44.1
1,164 39.2
1,282 1,383
39.1
1,577 35.1 36.1
1,644
25.2 1,719 1,729
41.3
 6.9 8.0 9.7
29.6 20.4
12.5 13.9 18.2
10 575 566 543 498 466 415 350 314 289 0
 0
Source: Ministry of the Interior, R.O.C. (Taiwan)
▏Section 2 Birth and Death
Dependency ratio
1981 1986
1991 1996
2001 2006 2011 2016 2021 Year
x 1,000) rose from 5‰ in the 1980s to 7.8‰ in 2021, because the proportion of the elderly population was increasing. The overall impact has been a decline in the rate of natural increase (crude birth rate minus crude mortality rate), from over 10‰ in the 1980s to about 0.1‰ in 2019 and -0.3‰ in 2020, the first time negative growth seen; the rate in 2021 was -1.3‰ (Figure 2-4).
Taiwan's changing socioeconomic structure has led to a steady decline in the fertility rate. The crude birth rate (births/mid-year population x 1,000) fell from 20‰ in the early 1980s to below 10‰ in 2000s, and to 6.6‰ in 2021. The crude mortality rate (deaths/mid-year population
 Figure 2-4
Crude Birth Rate, Crude Death Rate, and Rate of Natural Increase, by Year
‰
25 20 15 10
5
0
  Crude Birth Rate
Rate of Natural Increase
Crude Death Rate
7.8 6.6
    Source: Ministry of the Interior, R.O.C. (Taiwan)
1981
1991 2001
2011 2021 Year
17
Health and Welfare Indicators
